According to Dennis Overbye, writing recently in the NY Times "there is a crisis brewing in the cosmos, or perhaps in the community of cosmologists". He adds that some astronomers believe the universe seems to be expanding too fast. Further, recent measurements of the distances and velocities of faraway galaxies don’t agree with a hard-won “standard model” of the cosmos that has prevailed for the past two decades. The latest result shows a 9 percent discrepancy in the value of the Hubble constant, which describes how fast the universe is expanding.
First, a bit of background: thanks to astronomer Edwin Hubble cosmology was put on a more secure observational footing on the basis of his "Hubble law". It is encapsulated by the graph shown below:

This relation between distance D to an extra-galactic object e.g. quasar, galaxy cluster) and its recessional velocity (v), has since come to be known as Hubble's law and is expressed:
v = cz = HD
where H is known as the Hubble constant, c is the speed of light and z is the red shift.
This quantity z measures the extent to which spectral lines, say L1 and L2, are shifted to the red (longer wavelengths) compared to the normal spectrum, say of an element like hydrogen. The greater this shift the higher the velocity of recession.
The image below illustrates this for two extragalactic objects:

In fact 'H' is more technically the Hubble "scale factor". The REAL Hubble constant (H o ) is the scale factor (a) divided by the distance in megaparsecs MPC (km) where 1 parsec = 3.26 light years.
If then currently MPC (km) = 3.08 x 10 19 km/ Mpc then:
H o = a / MPC(km) = 2.26 x 10 -18 s -1
Then the age of the cosmos can be obtained from: t o = 1 / H o =
(1 / 2.26 x 10 -18 s -1 ) = 4.4 x 10 17 s = 1.3 x 10 10 yrs. or 13 billion years in age
The scale factor a, called the "Hubble constant", is currently a » 70 km/ sec/Mpc. But as I reported last summer, e.g.
http://brane-space.blogspot.com/2016/06/arriving-at-hubble-constant.html
has since been refined to a = 72.8 km/ sec/Mpc.
Clearly then what we call the Hubble constant depends on the accuracy of a, and this in turn depends on the latest techniques to attain more exact values. As I noted in the preceding link the newer, more exact value has been based on refining the universe’s current expansion rate to unprecedented accuracy, reducing the uncertainty to only 2.4 percent.
However, an uncertainty of even just 2.4 percent means we cannot be talking about a real physical constant, but only an approximate factor that determines the proportionality value H in the Hubble law. This is important to process before continuing. My point is that the "discrepancy" with the standard model is a separate issue, because the standard model itself is still under scrutiny, although it's gained much more traction with the discovery of the Higgs boson.
This elicits the question of whether this small "mismatch" (Overbye's term) is truly an indicator of how well we know the cosmos. According to Wendy Freedman of the University of Chicago, who has spent most of her career charting the size and growth of the universe:
“If it is real, we will learn new physics,”
Perhaps. But I don't think the 'new physics' will enter until we also are able to incorporate the role of dark energy, which has been identified as the primary agent responsible for the accelerated expansion. Relevant to this we invoke what can be called a cosmological "equation of state" (think of something like the equation of state for an ideal gas, e.g. P = nkT) for the vacuum energy presumed to underlie most theories of dark energy . This is:
One advantage is that this equation of state is consistent with Einstein's general theory of relativity - which one could say approaches the status of a 'basic law of physics'.
First, a bit of background: thanks to astronomer Edwin Hubble cosmology was put on a more secure observational footing on the basis of his "Hubble law". It is encapsulated by the graph shown below:

This relation between distance D to an extra-galactic object e.g. quasar, galaxy cluster) and its recessional velocity (v), has since come to be known as Hubble's law and is expressed:
v = cz = HD
where H is known as the Hubble constant, c is the speed of light and z is the red shift.
This quantity z measures the extent to which spectral lines, say L1 and L2, are shifted to the red (longer wavelengths) compared to the normal spectrum, say of an element like hydrogen. The greater this shift the higher the velocity of recession.
The image below illustrates this for two extragalactic objects:
In fact 'H' is more technically the Hubble "scale factor". The REAL Hubble constant (H o ) is the scale factor (a) divided by the distance in megaparsecs MPC (km) where 1 parsec = 3.26 light years.
If then currently MPC (km) = 3.08 x 10 19 km/ Mpc then:
H o = a / MPC(km) = 2.26 x 10 -18 s -1
Then the age of the cosmos can be obtained from: t o = 1 / H o =
(1 / 2.26 x 10 -18 s -1 ) = 4.4 x 10 17 s = 1.3 x 10 10 yrs. or 13 billion years in age
The scale factor a, called the "Hubble constant", is currently a » 70 km/ sec/Mpc. But as I reported last summer, e.g.
http://brane-space.blogspot.com/2016/06/arriving-at-hubble-constant.html
has since been refined to a = 72.8 km/ sec/Mpc.
Clearly then what we call the Hubble constant depends on the accuracy of a, and this in turn depends on the latest techniques to attain more exact values. As I noted in the preceding link the newer, more exact value has been based on refining the universe’s current expansion rate to unprecedented accuracy, reducing the uncertainty to only 2.4 percent.
However, an uncertainty of even just 2.4 percent means we cannot be talking about a real physical constant, but only an approximate factor that determines the proportionality value H in the Hubble law. This is important to process before continuing. My point is that the "discrepancy" with the standard model is a separate issue, because the standard model itself is still under scrutiny, although it's gained much more traction with the discovery of the Higgs boson.
This elicits the question of whether this small "mismatch" (Overbye's term) is truly an indicator of how well we know the cosmos. According to Wendy Freedman of the University of Chicago, who has spent most of her career charting the size and growth of the universe:
“If it is real, we will learn new physics,”
Perhaps. But I don't think the 'new physics' will enter until we also are able to incorporate the role of dark energy, which has been identified as the primary agent responsible for the accelerated expansion. Relevant to this we invoke what can be called a cosmological "equation of state" (think of something like the equation of state for an ideal gas, e.g. P = nkT) for the vacuum energy presumed to underlie most theories of dark energy . This is:
w = (Pressure/ energy density) = -1
One advantage is that this equation of state is consistent with Einstein's general theory of relativity - which one could say approaches the status of a 'basic law of physics'.
In
this case, the existence of a negative pressure is consistent with general
relativity's allowance for a "repulsive gravity" - since any negative
pressure has associated with it gravity that repels rather than attracts. (See,
e.g. 'Supernovae, Dark Energy and the Accelerating Universe', by Saul
Perlmutter, in Physics Today, April, 2003, p. 53.) Of course, simple
algebra applied to the above also shows that the energy density would have
to be negative, e.g. energy density = - (pressure).
Specifically the term (r + 3p) acts as a source of
gravity in general relativity, (where r = energy density).
To ascertain the proportions of dark matter and dark energy one uses graphs derived
from supernova data with corrected apparent visual magnitude m v , redshift (z), to give
different combinations of W dark to W matter over the range. However, only one of the graph
combination bests fits the data. Currently this yields:
Wdark = 0.68 and Wmatter = 0.27
As a result, astronomers have accepted that the universe consists of roughly 5 percent atomic matter by weight, 27 percent dark matter and 68 percent dark energy . The last is what's speeding up the cosmic expansion.
Wdark = 0.68 and Wmatter = 0.27
As a result, astronomers have accepted that the universe consists of roughly 5 percent atomic matter by weight, 27 percent dark matter and 68 percent dark energy . The last is what's speeding up the cosmic expansion.
Back to the link above for my earlier post last summer citing a team led by Adam Riess of Johns Hopkins University and the Space Telescope Science Institute, using the Hubble Space Telescope and the giant Keck Telescope on Mauna Kea in Hawaii . They obtained a value with only 2.4 percent uncertainty - but as I pointed out- this is still nowhere near acceptable constant territory. Check any table of physical constants - actual ones, like the Newtonian G, or speed of light c - for comparison.
The claim of Overbye in his piece is that this "made waves because it meant that, if true, the Hubble constant as observed today was now clearly incompatible with a result of the lower slower value of 67 inferred from data obtained in 2013 by the European Planck spacecraft of relic radiation from the Big Bang."
But how big were these "waves", really? Those Planck mission observations revealed the universe when it was only 380,000 years old and these are considered "the gold standard of cosmology." But how reliable and trustworthy is this gold standard? Interestingly, whether the standard cosmic recipe might now need to be modified depends on whom you talk to.
Personally, I side with the higher H values because I place more confidence in the supernova data and observations, redshifts derived therefrom, than the Big Bang Plank observations. Heresy? Maybe, but there it is. Also, Prof. Riess has admitted that the Planck mission measured the Hubble constant only indirectly as one of several parameters, i.e. in the standard model of the universe. So why would you place more faith in those measures than the supernovae data?
Bolstering this POV, another group called H0LiCOW (short for H0 Lenses in COSMOGRAIL’s Wellspring), from the Max Planck Institute for Astrophysics in Garching, Germany, reported its own value of 72 km/ sec/Mpc , also inconsistent with the lower value from the Planck space mission’s analysis. This interjects the question of whether the "Big Bang' results might themselves be spurious and based on as yet undetected systematic or other errors. Or, perhaps the Standard Model itself needs revision. (See addendum).
Stay tuned, because the issue isn't resolved yet, but for my money, the high z supernova data hold the key. Until I see much more consistency in the results from the "Big Bang"- Standard model teams.
--------------------------------------
Addendum on the Standard Model- Higgs boson discovery:
The so-called 'Standard Model' is generally defined as the symmetry:
SU(3) x SU(2) X U(1)
where each of the above denotes a specific matrix, or more exactly a group. See, e.g.
http://brane-space.blogspot.com/2010/04/looking-at-groups.html
In the case of SU(2) we describe it as the "special unitary group" which has the form:
S =
(a.........-b*)
(b..........a*)
where a*, b* are complex conjugates and we have (aa* + b*b) = 1. Thus the elements of SU(2) are the unitary 2 x 2 matrices with DET (determinant) = 1. These groups thus define the behavior of a specific class of subatomic particles. Spontaneous symmetry breaking would therefore resolve this combination into constituent parts, e.g.: SU(3) associated with the 'color force' of quarks:
SU(2) x U(1)
associated with the electro-weak force.
One possible symmetry breaking (quark -boson format) is:
SU(3) x SU(2) X U(1) -> SU(3) + SU(2) x U(1)
which would occur at a particular ambient temperature (T_qb) for the universe at some epoch (E_qb) in the past. In the foregoing, the synthesis of SU(2) and U(1) into the locally gauge invariant electro-weak theory requires a mechanism which confers mass to three vector bosons while leaving the photon massless. This 'mass-giving' mechanism is called the Higgs Field or Higgs mechanism, and it demands the existence of one or more massive, spin-0 bosons otherwise called Higgs bosons.
Enter now the putative discovery of the Higgs, thanks to the large hadron collider, which was announced at CERN. Dr. Rolf Heuer, director general of CERN, while referring to the new discovery as "a historic milestone" nevertheless cautioned that it was too soon to know for sure if the new particle (coming in at 125 billion electron volts) is actually the long sought particle.
The problem? The culmination of analyses of over 800 trillion proton-proton collisions over the 2 years leading up to the announcement generated a quandary. When buttonholed, the physicists admitted they actually knew little. The CERN results were mostly based on measurements of two or three of the dozen different ways, or “channels,” by which a Higgs boson could be produced and then decay. Worse, there were hints that some of the channels were overproducing the Higgs while others might have been underproducing. In either case, false positives or false negatives, one had to look askance at the initial results.
The upshot? There may not have been a real Higgs discovered but a spurious 'mirage' imitating some of its properties but more a confection of the data than based in reality. Also, assuming a genuine signal or find, it may not have been unique but only ONE of two or three different Higgs bosons. Much like the case of the neutrino, which was once believed to be one entity only, but we now know is THREE: the electron neutrino, the tau neutrino and the muon neutrino, see e.g. http://brane-space.blogspot.com/2012/06/solving-neutrino-puzzleand-matter.html


 (cos
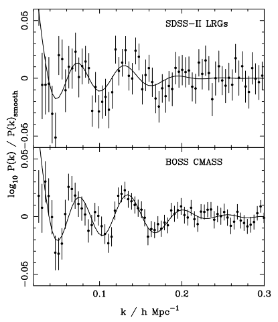
 ) to treat the acoustic oscillations. Only now, as a function of galaxy fluctuations of a given scale - related to the wave number k. (Abscissa for the lower graphs shown).