The recent news (ASTRONOMY, digital version) that a college senior, not even a grad student, discovered four new exoplanets should not be surprising. If one has the right equipment and techniques this is not a biggie. Indeed, as an associated article in the print issue of the magazine (July, p. 62) notes:
"With advances in CCD imaging and the development of supporting software, amateurs can now produce exoplanet observations of sufficient quality that professionals can use them to supplement their own studies."
The basic principle at work is elementary to grasp and illustrated by the two graphics shown. In the top image the exoplanet passes in front of its parent star producing a dip in the light curve over a defined interval t2 - t1. Below, we see a specific example in the case of Wasp -12b for January 6, 2016. The light curve dip is readily visible over an interval t2 - t1 = 2h 50 m. approximately. The assorted dots lining the light curve represent different observations.

In the case of variable stars, it isn't even necessary to have elaborate equipment to do a respectable plot of a light curve. You need only good eyes, good star charts (with magnitudes shown) and the ability to compare the (estimated) brightness of the target star with the known magnitudes of those comparison stars in the vicinity.
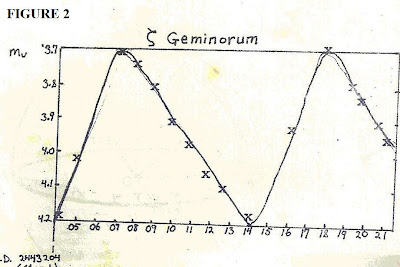
In effect, one is undertaking basic differential photometry invoking the same basic principle used to make exoplanet observations, and deriving light curves from those. A student in Barbados (below)was among the first to do a variable star light curve on the island nearly forty years ago.

Over a period of two and a half weeks (17 Julian Days) Stephen Hinds patiently compared brightnesses of the target star Zeta Geminorum with nearby comparison stars to arrive at the light curve shown below:

Thereby he was able to arrive at the maximum magnitude (+3.7) and the minimum (+4.2) with a period of approximately 10 days. The same sort of technique can be used to estimate exoplanet brightness changes compared to surrounding stars, except that the naked eye will not be enough and one will need at least a good telescope to do the comparisons, using a CCD detector.
But for the average person, just doing a variable star light curve can be interesting enough and provides the opportunity to do real astronomy, such as done by the American Association of Variable Star Observers (AAVSO).
An excellent test subject currently visible is the Algol-type variable Beta Lyrae. The interested observer using differential brightness comparisons ought to be able to generate its light curve, e.g.
Showing a magnitude change from +4.4 to +3.3. over the period indicated (the full orbital period is 12.94 days)
For those with a good Schmidt-Casegrain telescope (e.g. 11" aperture) and a CCD camera it's possible to actually go into exoplanet observations - and post results online as part of the Exoplanet Transit Database, e.g.
http://var2.astro.cz/ETD
Whether you go for the basic project of variable star light curve assembly, or exoplanet transits, one thing in common is the importance of models. In all cases bear in mind the difference between the observed data and what a purported model predicts is the measure of 'goodness of fit'.
For those who'd just like to do a light curve on Beta Lyrae the map below may be useful, showing the position of Vega in relation to the "Northern Cross" (Cygnus):

Section of star chart to locate Beta Lyrae. Print out the map, and using a flashlight- hold it upside down facing north - to locate the Northern Cross first. The very bright star Vega will be to the W-SW of the Cross and the star Deneb.
Beta Lyrae is the star at the lower left corner of the parallelogram for Lyra.
No comments:
Post a Comment