One of the many books examining the limits of statistics
'Lies, Damn Lies and Statistics' has been the title of a number of texts (with some variation) since the original Penguin monograph was published more than 45 years ago. Each iteration has more or less been concerned with three aspects; i) the innumeracy of those who use statistical arguments but don't understand them, ii) the deliberate abuse of statistics by those who do understand them, and iii) the confusion sown in the public at large when confronted by stats across a broad constellation of issues from Covid death rates, to the probability of asteroid impacts, to the temperature increase threshold for the runaway greenhouse effect, to the real rate of inflation.
In his book, The Data Detective, Tim Harford (an economist and Financial Times columnist) takes on statistical analysis, e.g. in academic research, and why one needs to look at it in context and also that it doesn't just arrive pre-packaged as if from Mount Olympus. Thus, while at first glance data may appear objective and pure, the underlying assembly and treatment may not be so pure.
Failure to replicate a study is one way by which data may be recognized as either carelessly assembled, applied or not subjected to enough analysis before rendering a conclusion. A number of such failures have occurred in psychological research, including: failure to confirm one 1988 study that "smiling makes one happier", and "being reminded of money makes one selfish".
One of the classic fails in physics was the "cold fusion" research of Pons and Fleischmann. In 1989 they presented data from experiments purportedly showing nuclear fusion achieved at room temperatures. What could have been a momentous discovery in terms of energy research withered away after other teams of physicists were unable to replicate the findings. A primary reason? The enhancement in temperature detected from the experiments was found not be significantly more than their measured statistical uncertainty.
Take my own research into the connection of sunspot morphology to the occurrence of solar flares that produce sudden ionospheric disturbances (SIDs) . Enter now Harford's core observation that a large part of the confusion surrounding academic papers are "imprecise and inconsistent" definitions. I also realized this at the time so had to make clear what the object of inquiry was, i.e. not an SID that gave rise to a flare, but the converse - a flare that gave rise to an SID.
But the flares themselves had to be tied to sunspot groups and there was no sunspot group with a pre-labelled tag "SID flare to come". I had to identify the SID flares by ensuring every spot group indexed (out of hundreds) could feasibly be linked (by proximity of heliographic location) to the site of a specific flare with a minimal soft x-ray flux (at SID threshold). What determined "proximity"? I subjectively determined it to be within a half of a degree of heliographic longitude.
This necessitated months of observations of sunspots using the Harry Bayley Observatory telescope as well as x-ray, radio and other observations for flares assembled month by month in Solar Geophysical Data. In addition, culling through the sunspot data published in the latter as a cross check, and comparing it with coordinates of observed H-alpha flares with their importance (optical, and SID importance).
One of the first realizations was that I would have to work with a limited sample set. It was absurd to attempt to look at every sunspot group and associated flare occurring over an entire 11 year cycle. So I limited the sample set to the Solar Maximum Year (1980), which was reasonable and practical. Other selection effects that entered included: use of Mt. Wilson magnetic classes for identifying magnetic morphology, which are coarse categorizations only; this use in turn introduces a further selection effect with respect to time, i.e. if there is some (SID) flare incidence that occurs in less than a day it would not have been exposed given the Mt. Wilson classes are identified daily only. Also the use of vector magnetograms, such as: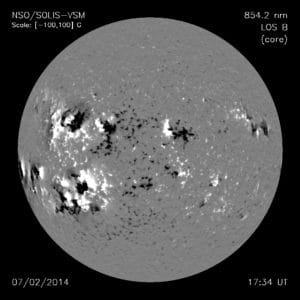
are normally made between 18h00m and 19h00m each day so flares occurring outside this interval (say for rapidly evolving sunspot groups) could lead to a 'mismatched' flare-sunspot magnetic class association. All of these factors were described in the several papers published (in Solar Physics) to do with SID flares.Given that optical images (H-alpha) were used to identify the nearest flares to suspect spot groups, the assumption was made that H-alpha flares could only be in the SID flare category if their emitted soft x-ray flux exceeded 2 x 10 -3 erg cm -2 s -1 (cf. Swider, W. 1979). This assumption necessitated close inspection of the soft x-ray records from the SMS-GOES satellite to ascertain the times for peak emission which later had to be tied to times of optical (H-alpha) flare occurrence. A typical soft x-ray flux record with the SID flares identified by SID and optical importance is shown below:
All this is intended to show that -as Harford points out - data do not just appear "as if by divine providence from the numerical heavens." A lot of 'messiness' and outright "sausage making" is often involved in scientific research, even to publish a fairly straightforward paper on the associations between sunspots and flares.
Many of these limitations were noted in my paper :‘Limitations of Empirical-Statistical Methods of Solar Flare Prognostication’ appearing on pp. 276-284 of the (Meudon) Proceedings on Solar -Terrestrial Predictions.
My paper showed the limits of prognostication for given (magnetic, optical, radio) observational thresholds. Also pointed out, but in other papers and my thesis, was the lack of discriminative ability to show energy release - in solar active regions. Much of this could be attributed to using crude measurement sources at the time, for example in assembling the table below showing the angle of shear ( f) and relation to vertical current density (Jz) changes.
|
DATE
|
Jz (A m –2)
|
a ( m –1)
|
f
(deg)
|
|
11- 5-
80
|
0.
0058
|
3.1 x
10 -8
|
80 o
28’
|
|
11- 6-
80
|
0.
0048
|
2.5 x
10 -8
|
80 o
47’
|
|
11-7-
80
|
0.
0049
|
2.5 x
10 -8
|
80 o
57’
|
|
11- 8-
80
|
0. 0062
|
3.2 x
10 -8
|
80 o
47’
|
where Jz is vertical current density (estimated
from fibril orientation and vector magnetograms) and f is the shear angle. By inspection one sees that none
of the force-free parameter values over the interval attains the magnitude
needed for instability. Hence, over this time period, one is tempted to say
that the dipole conforms to the case (a) of being line-tied.
However,
inspection of the energy release graph over the same interval yielded:
with
a spike on Nov. 7. Clearly, some manner
of failure occurred in the dipole and it reverted to a system configuration
analogous to that peculiar to minimal line-tying However, this was not reflected in the angle of shear which remained essentially unchanged in magnitude over the time interval.
Lastly, Harford hammers on an issue I also have found irritating: the perverse incentives that prompt academic researchers to over publish, i.e. "If you have a result that looks publishable but fragile, the logic of science tells you to try to disprove it. Yet the logic of academic grants and promotions tells you to publish at once and for goodness sake don't prod it too hard."
This may be one reason numerous studies in psychology, for example, have been difficult to reproduce. Here, Harford notes (and I do) that a publication bias may apply. Thus, there is a perverse incentive for these psych journals (among others) to publish unexpected or contrarian results as opposed to "sturdier but less catchy" titled ones. The result? Over publishing!
According to one 2007 study , half of academic papers are read only by their authors and journal editors. This is nothing short of astounding but makes sense if one understands the dynamic of publishing pressure and how it is more often used to secure or determine academic promotions than to disseminate useful information.
See Also:


No comments:
Post a Comment