Showing posts with label partition function. Show all posts

Tuesday, December 18, 2018

Statistical Mechanics Revisited (1)

Statistical mechanics (also statistical physics),  is that branch of physics  (according to Britannica.com) that combines the principles and procedures of statistics with the laws of both classical and quantum mechanics, particularly with respect to the field of thermodynamics.  This definition is useful for our purposes but also leaves out a lot, namely that what we have is a detailed probability theory (as mathematics oriented to physical states and spaces) applied to the behavior of microscopic particles.


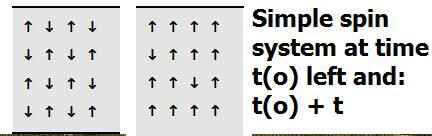
The "Ising model" is central to many problems and systems in statistical mechanics.  It first came to the fore in the study of ferromagnetic systems. It was found that the use of such simplified models paved the way for greater understanding via modeling of more complex systems.  Let's now look at an elementary, statistical mechanical spin system.  A fairly  mundane example is a two-dimensional Ising model for ferromagnetic matter. It contains magnetic domains for which the individual spin magnets can be subject to sudden reversals. For a simple example, think of the 2D model of 4 x 4 elementary spin magnets as shown below:
Related image
 
Here the Ising model system, by virtue of undergoing spontaneous magnetization  discloses an evolution to a higher degree of order  (from state S(1) to state S(2)) at the later time t(0) + t, where t could be in billions of years or nanoseconds.

The degree of order, as well as information, is determined from what is called "the spin excess", or the net spin difference (up minus down or vice versa). The larger this number, the greater the degree of order, and the lower the entropy of the system. Obviously, since 0 denotes an extremely low number, we can deduce large entropy.

Consider the system S(2) in more detail, noting the right side orientations of the elementary spin magnets. Here we get: 14 spin ups - 2 spin downs = 12 spin ups, or in other words the spin excess = 12. This system, S(2), has much higher degree of order (less entropy) than the system S(1). (We should add here that higher entropy - as in S(1) - corresponds to the most probable state, defined by the minimal spin excess of zero.)


Accessing such simple systems allows us to infer fundamental measures applicable to the systems, for example the "magnetic moment" of a state, as well as the "degeneracy function". Consider an N= 2 model system with either 2 ups (two up arrows) or 2 downs. 

Then, if  m  denotes the magnetic permeability we can have:

M = + 2 m   or M = -2 m

where the first is the magnetic moment for two spin- up particles, and the second for two spins down. One can also, of course, have the mixed state inclusive of one spin up plus one spin down, then:

M = O m or O

Meantime, the degeneracy function computes the number of states having the same value of m (individual spins) or M such that:

g(N,m) = N!/ (½N + m)! (½N - m)! [Mav]


where [Mav] denotes the average value of the total magnetic moment summed over all states (e.g. with ms)

The power of the Ising model, however, doesn't end with ferromagnetic systems. We can also use it to examine ice crystal configurations as has been shown in a recent paper by Andrei Okounkov (Bulletin of the American Mathematical Society, Vol. 53, No. 2, p. 187).  In this paper the author presents us with the 2D ice crystal Ising model shown below:
No automatic alt text available.

Each white square denotes an ice crystal and the blue areas represent separating media. Certain model stipulations apply as given in the paper: 1) the total number of white squares is fixed, just as the total number of elementary magnets in the earlier system; 2) all squares along the boundary are deemed blue in order to prevent crystals sticking to the sides of the container, and 3) It must be possible to assign probabilities to the configuration in the same way we might assign "order" or entropy to the ferromagnetic system.

The most basic probability for any such system is "thermal equilibrium". Thus, at some temperature T if the system attains thermal equilibrium then the probability of any particular configuration decays exponentially with the energy of C, which is analogous to E  = 
 m m  B in the ferromagnetic case. The probability of any particular configuration dependent on T is then:

Prob (C) = 1/ Z(T) [exp (-Energy (C)/ kT)

Where k is Boltzmann's constant, 1.38 x 10 -23  J /K.

One will also make use of the  "partition function":

Z(T) =  
å C   exp (- Energy (C)/ kT)

which as Okounkov notes, really functions as a "normalization factor"  given that it "makes the probabilities sum to 1".  In this Ising ice crystal model, then, the energy is "the sum of interactions of all adjacent squares." Since the total number of squares is fixed (see stipulation (1))  then the energy must be proportional to the total length of the contours separating white from blue.

To identify the contours is easy. If the energetic reader will run off  a copy of  the image of the 2D rectangle, then take a black magic marker and trace around each ice crystal region as it appears, he will have generated the contours. The normalization for energy is then (op. cit.):


Energy = 2 x Length of contours

As in the case of the ferromagnetic system entropy competes with order (energy).  In the Ising ice crystal energy is saved via clumping. If we designate an "order parameter" such that  
b = (kT)-1  then in the ice crystal case the larger   b   the stronger tendency for order. Interestingly, as Okounkov notes there is a critical temperature  Tc  > 0 above which entropy wins, it is:

b  =  0.5 ln ( 
Ö 2    + 1)  

Below Tc  and for ice crystal concentrations above a certain threshold a crystal will form as the size of the container goes to infinity.

Problems:

1) Quantify the magnetic energy for the system at time t(o) compared to time t(o) + t, if the magnetic energy of one spin magnet can be written:

M = - m B cos Θ

where m  is the magnetic moment (-eL/2m, L = 1) and assume Θ = +/- π, and B = 0.1T. 

2)  Say that S = log (g) determines the entropy for a  simple statistical mechanical system, where g denotes the number of accessible states. Then estimate S for the 2D ice crystal model - including any errors that might enter.


Monday, December 10, 2018

Stellar Absorption and Emission Processes Revisited (2)

In approaching stellar line formation we will be looking at a number of related equations, including:
1)      The Boltzmann equation

2)     The Saha equation

3)     Combined Boltzmann and Saha equations


These will enable us to form a picture of spectral line formation which can then be generalized for different atoms and energy transitions.  We start then with the Boltzmann equation, which we already introduced in the previous chapter:


N2 / N1   =     [g2 / g1 ]   exp (- E2 – E1) / kT


That is, for the atoms of a given element in a specified state of ionization, the ratio of the number of atoms N2 with energy E2, to the number of atoms N1   with energy E1, in different states of ionization is given by the above formula. The same form of the equation can also be used to find the ratio of probabilities, i.e. that the system will be found in any of the  g2   degenerate states with energy E2 to the probability that the system is in any of the g1   degenerate states E1, viz.


P(E2) / P(E1)   =     [g2 / g1 ]   exp (- E2 – E1) / kT


Thus, the Boltzmann equation can be posed in two forms.  In statistical mechanics we could have also seen the partition function:


Z  =   å j   exp ( - e j )/ t


Which is just the summation over the Boltzmann factor (exp ( - e j )/ t ) for all states j for which the number of particles (N) is constant. We will find it useful to rewrite it:


Z = g1 +  å¥ j = 2   g j  exp (- E j – E1) / kT

 
Of interest now are the relative numbers of atoms in ionization stage i, which is written:


N e N i + 1 / N i  =  2 Z i + 1 / Z i (2 p m e kT/ h 2) 1.5  e - c i/ kT


This is the Saha equation, named after the Indian astrophysicist who first derived it.  Here,  N e  is the number of free electrons per unit volume and c i  is the ionization potential of the ith ionization stage. Thus, the equation relates the number of atoms in two successive  ionization stages to the quantities that are relevant. As per our introduction to quantum mechanics, the factor ‘2’ in the equation refers to the two possible spins of the free hydrogen election with spin quantum number:

m s =  +½.


 Recall that for thermodynamic equilibrium, the rate of ionization cannot exceed the rate of recombination[1].  In other words, the rate at which atoms in the ith stage are ionized (i.e. to the i +1st stage) must equal the rate at wich ions in that i +1st stage are recombining with free electrons to form ions in the ith stage. The latter depends on N e N i + 1   and the former on N i . Hence, Saha’s equation simply expresses the fact these two processes must occur at the same rate.

One can also rewrite the equation in a more manageable logarithmic form if one substitutes the numerical constants:
log(N e N i + 1 /N i)  = 


15.38 + log (2 Z i + 1 / Z i ) + 1.5 log T – 5040 c i/ T


The units here are important to note, and are consistent with the ionization potential being measured in electron volts (eV). Therefore N e  must be in particles per cubic centimeter.


    Yet another way to express the Saha equation is via the electron pressure, P e . This acknowledges that each separate species of particle makes its own contribution to the total gas pressure. The free electrons in a gas therefore produce a pressure given by: P e = N e kT.


Then we may write another log form of the Saha equation:


log(P e N i + 1 /N i)  = 


-0.48  + log (2 Z i + 1 / Z i ) + 2.5 log T – 5040 c i/ T


There are also two distinct processes by which lines can be formed:

 
1)      Bound-bound transitions
2)     Bound-free transitions

In the first case, the photon goes from one bound atom to another. Also, in case (1) the photon has a good chance of being scattered, i.e. emitted in the same downward transition.  This may be at the same frequency as the absorption, in which case we say the scattering is coherent, or not, in which case it is non-coherent.
Details of bound-bound transitions differ in significant ways from bound-free transitions. In the first case, the transitions are also affected by a broadening function which is not so important for continuous emission. If we write out the equation for absorption in more detail we get:

a u  =  [1 - e -  h u o / kT] (p e2/ mc) f f u
which yields units in  cm2 / atoms at lower level. Two other absorption derivative values are possible from the preceding:

 
i)                   The absorption coefficient per unit length (cm-1)
ii)                 The mass absorption coefficient  k u .

 The value for (i) is just a u  multiplied by the number of absorbing atoms per unit volume. The value for  k u  is just  multiplied by the number of absorbing atoms.  

The value for a o   is just:  a o =  a u  /  f u.  

Sometimes referred to as a “fudge factor”, f is known as the oscillator strength or f-value of the line. It is basically the  laboratory.
The broadening function  f u  is:

f u  =   1/ Öp   [exp (u  -u o)  /D u D ]2  D uD
Which can also be rewritten as:   f u  du  =

1/ Öp   [exp (u  - u o)  /D uD ]2  du / D uD

This would be the probability that the absorbed photon lies between u  and  u +  du, assuming equal intensities for all frequencies. Thus the integral:

ò f u  du  =  1

 
Where du is over all frequencies.  The value of f u  is larger near  u o  the frequency of the line center, as may be deduced from the line profile diagram below:

Absorption line profile showing the core and "wings"

Note here that  D uD  is the Doppler half-width of the line. As can be seen on inspection, f u is very large at line center and falls off in the “wings”, i.e. at larger and smaller frequencies.
 The three important types of line broadening are doppler effect, natural and pressure broadening. We will confine our attention to the first type which is given by the broadening probability equation, provided the velocity is Maxwellian and that the frequency at line center  u o is also observed for some u . The Maxwellian will display the distribution of velocities as shown below where the central line defines the most probable.
Maxwellian showing distribution of velocity with proportion of particles.

For the Sun, solar physics, it is also necessary to consider the Zeeman effect, a broadening due to strong magnetic fields such as in sunspots. An example of this applied to a sunspot is depicted below:
The left image shows the line-centered sunspot for which the Zeeman effect in classic "triplet" form (right image) is detected and measured. The greater the spectral line splitting the greater the magnitude of the associated magnetic field.  George Ellery Hale, who discovered the effect, posed the quantitative relationship in terms of the original wavelength   lo  (undisturbed line) and the spread of wavelengths, D  l:


D  l =     (lo)2  e H/ 4 π  me c2  


Where H is the intensity of the sunspot magnetic field in gauss (to be found), e is the electron charge in e.s.u.,  me  is the mass of the electron in grams, and c the velocity of light in cm/ sec.


Problems:

1) For the temperature and conditions of problem (1) of the previous set, find the ratio of the probability that the system will be found in any of the eight degenerate states of energy level E2, to the probability that the system will be in any of the two degenerate states of energy level E1.


2) An H-alpha line undergoes triplet splitting in the vicinity of a sunspot. The undisturbed line is measured at:   lo  =    6.62 x 10  -5 cm. The line shift on either side is: + 0.0025 Å.   Use this information to find the strength of the sunspot magnetic field: a) in gauss, b) in Tesla.

Sunday, August 28, 2016

Looking At Simple 2D Ising Models

The "Ising model" first came to the fore in the study of ferromagnetic systems. It was found that the use of such simplified models paved the way for greater understanding via modeling of more complex systems.  A fairly  mundane example is a two-dimensional Ising model for ferromagnetic matter. It contains magnetic domains for which the individual spin magnets can be subject to sudden reversals. For a simple example, think of the 2D model of 4 x 4 elementary spin magnets as shown below:

No photo description available.

 Here the Ising model system, by virtue of undergoing spontaneous magnetization (say from a state S(1) with spin excess 0 to state S(2) with spin excess 12 , discloses an evolution to a higher degree of order at the later time t(0) + t, where t could be in billions of years or nanoseconds.

The elementary magnets may exist temporarily in the state S(1) as shown  (i.e. each arrow denotes the net spin of the atom based on the sum of electron orientations within it). We then may want to find the degree of order applicable to the system, say at time t(o) and do the appropriate counting of "spin ups" and spin downs" as shown in the left side of the model.  We find on doing so (which the reader can verify) that we get 8 spin ups - 8 spin downs = 0 net spin, or in other words the system is at equilibrium.

Consider then the same system but at a later time (t(0) + t) , for which we behold the right side orientations of the elementary spin magnets. Here we get: 14 spin ups - 2 spin downs = 12 spin ups, or in other words the spin excess = 12. This system, call it S(2), has much higher degree of order (less entropy) than the system S(1). (We should add here that higher entropy - as in S(1) - corresponds to the most probable state, defined by the minimal spin excess of zero

The degree of order, as well as information, for the simple spin system shown is determined from what is called "the spin excess", or the net spin difference (up minus down or vice versa). The larger this number, the greater the degree of order, and the lower the entropy of the system. Obviously, since 0 denotes an extremely low number, we can deduce large entropy.

Accessing such simple systems allows us to infer fundamental measures applicable to the systems, for example the "magnetic moment" of a state, as well as the "degeneracy function". Consider an N= 2 model system with either 2 ups (two up arrows) or 2 downs. Then, if m denotes the magnetic permeability we can have:

M = +2m or M = -2m

where the first is the magnetic moment for two spins up particles, and the second for two spins down. One can also, of course, have the mixed state inclusive of one spin up plus one spin down, then:

M = O m or O

Meantime, the degeneracy function computes the number of states having the same value of m (individual spins) or M such that:

g(N,m) = N!/ (½N + m)! (½N - m)! [Mav]


where [Mav] denotes the average value of the total magnetic moment summed over all states (e.g. with ms)

The power of the Ising model, however, doesn't end with ferromagnetic systems. We can also use it to examine ice crystal configurations as has been shown in a recent paper by Andrei Okounkov (Bulletin of the American Mathematical Society, Vol. 53, No. 2, p. 187).  In this paper the author presents us with the 2D ice crystal Ising model shown below:
No photo description available.
Each white square denotes an ice crystal and the blue areas represent separating media. Certain model stipulations apply as given in the paper: 1) the total number of white squares is fixed, just as the total number of elementary magnets in the earlier system; 2) all squares along the boundary are deemed blue in order to prevent crystals sticking to the sides of the container, and 3) It must be possible to assign probabilities to the configuration in the same way we might assign "order" or entropy to the ferromagnetic system.

The most basic probability for any such system is "thermal equilibrium". Thus, at some temperature T if the system attains thermal equilibrium then the probability of any particular configuration decays exponentially with the energy of C, which is analogous to E  = m m  B in the ferromagnetic case. The probability of any particular configuration dependent on T is then:


Prob (C) = 1/ Z(T) [exp (-Energy (C)/ kT)

Where k is Boltzmann's constant, 1.38 x 10 -23  J/K.

One will also make use of the  "partition function":

Z(T) =  å C   exp (- Energy (C)/ kT)

which as Okounkov notes, really functions as a "normalization factor"  given that it "makes the probabilities sum to 1".  In this Ising ice crystal model, then, the energy is "the sum of interactions of all adjacent squares." Since the total number of squares is fixed (see stipulation (1))  then the energy must be proportional to the total length of the contours separating white from blue.

To identify the contours is easy. If the energetic reader will run off  a copy of  the image of the 2D rectangle, then take a black magic marker and trace around each ice crystal region as it appears, he will have generated the contours. The normalization for energy is then (op. cit.):

Energy = 2 x Length of contours

As in the case of the ferromagnetic system entropy competes with order (energy).  In the Ising ice crystal energy is saved via clumping. If we designate an "order parameter" such that  b = (kT)-1  then in the ice crystal case the larger b   the stronger tendency for order. Interestingly, as Okounkov notes there is a critical temperature  Tc  > 0 above which entropy wins, it is:

b =  0.5 ln (Ö2    + 1) 

Below Tc  and for ice crystal concentrations above a certain threshold a crystal will form as the size of the container goes to infinity.

From this brief foray iwe can see that  the Ising model shows the great generality of physics, in being applicable to vastly dissimilar physical entities.