1) Obtain the line: y = mx + b which best fits the following data points:
(0.10, 0.10), (0.20, 0.20), (0.30, 0.30), (0.40, 0.40), (0.50, 0.50)
Solution:
It is evident on inspection: yobs = xobs and m =1 (constant slope)
Further b = 0, so the least squares line has D 2 = 0:
This yields: y = x
Graphing:
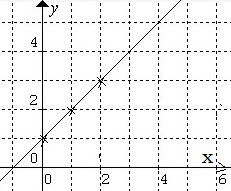
2) Apply the method of least squares to obtain the line y = mx + b which best fits the points: (0,1), (1,2), (2,3)
Solution:
Using the data we prepare the table:
For which: å (D 2 )= 14- 12b + 3b 2 - 16m + 5m 2
¶f/¶m = 10m + 6m – 16 = 0
Or: 16m = 16 so m =
1
¶f/¶b = 6b -12 + 6b = 0
So: 12b = 12 and b = 1.0
Hence: y = x + 1 is best fit line.
Graph is below:
3) In examining the frequency F of subflares within regions of sunspot area (A)* the following table of data is obtained:
Apply the method of least squares to obtain the line F = mA + b which best fits the points
Solution:
Use same technique as shown above, and we obtain:
m = 2.693 and b = 0.613
So best fit line to data: F = 2.693A + 0.613
Graph is shown below:


No comments:
Post a Comment